The Risk & Return Spectrum in Index-Linked Annuities
The easiest way to visualize where different annuity products slot into the market is by using a spectrum of risk and return. On one end is a classic declared rate Fixed Deferred Annuity (FDA) and on the other end is a Variable Annuity (VA), with Index-Linked products falling in between. Conceptually, organizing products this way makes a lot of sense and that’s how the products are often positioned with clients. The spectrum might look something like this:

On the spectrum above, FILA could stretch all the way from the beginning of FIA and to RILA depending on the client’s performance and choices. But for the purposes of this discussion, we assume that the client elects to put gains at risk throughout the term even though, in reality, they can (and potentially would) choose to take their gains off of the table by selecting a 0% Floor account that would mirror the performance of an FIA going forward.
Real-World Simulation of Risk and Return – Participation Rate
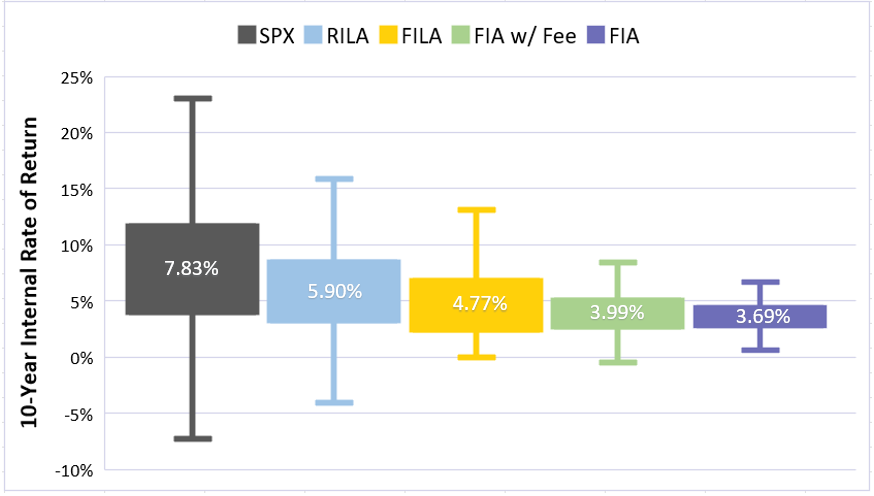
To get a feel for how these products might perform using realistic market return simulations, we ran 1,000 S&P 500-based 10-year scenarios through each product chassis using fair-market Participation Rates. The chart below shows the results of the simulation. The number in the box is the average annualized return. The box represents the middle 50% of returns with the top and bottom quartiles represented by the whiskers. The FIA with Fee assumes a fee of 1.5%. For FILA, the 0% Floor rates match the rates in an FIA. The rates for the -10% Floor match the rates for the RILA, which we assume is also allocated to a -10% Floor account.

In general, our findings are exactly what we’d expect to see – taking more risk leads to greater returns.
Real-World Simulation of Risk and Return – Cap
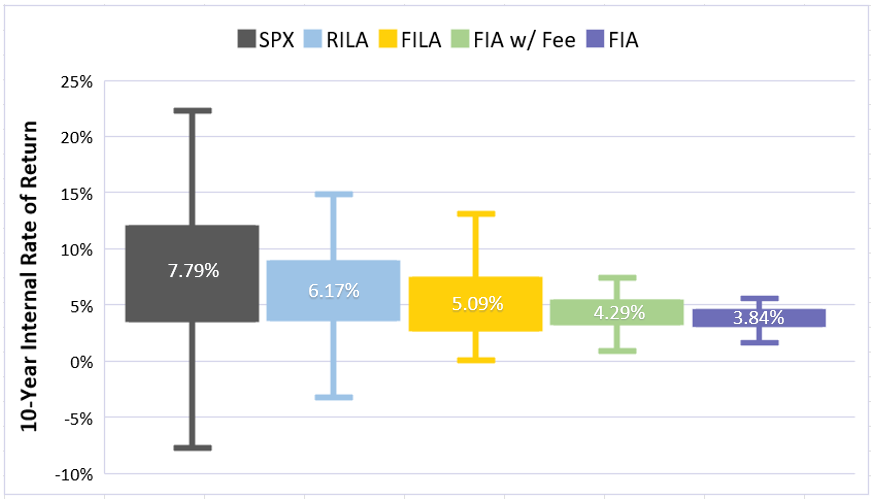
We re-ran the scenario but this time using Caps as the non-guaranteed element and assumed a 100% Participation Rate. The results are below and shown in the same way as the previous graph.

As expected, Cap designs generate lower average returns and less maximum upside potential than Participation Rates. However, the relative comparisons between the products hold. In terms of average return, RILA outperforms FILA by 1.13% using a Participation Rate and 1.08% using a Cap as the non-guaranteed element. FILA, in turn, outperforms FIA w/ Fee by .78% and FIA by 1.08% using a Participation rate and .80% and 1.25% using a Cap.
Rates used in this article reflect fair-market conditions in April of 2022 in order to align with a forthcoming, peer-reviewed academic paper that was submitted in April of 2022 by Thorsten Moenig, ASA and Bobby Samuelson. The paper explores both more and less favorable cap and par rate conditions and the relationship between the products does not change.