Sum Crediting Strategies
Monthly Sum crediting strategies have been a fixture of the FIA landscape for over a decade. The idea behind a Sum crediting strategy – referred to in derivative terms as a “cliquet” – is fairly straightforward. The strategy observes performance at defined intervals and credits the sum of each observation to produce the final performance credit amount allocated to the strategy. In broad strokes, the chart below shows how an Annual Sum strategy would have calculated returns on the S&P 500 from 12/31/2004 to 12/31/2011.
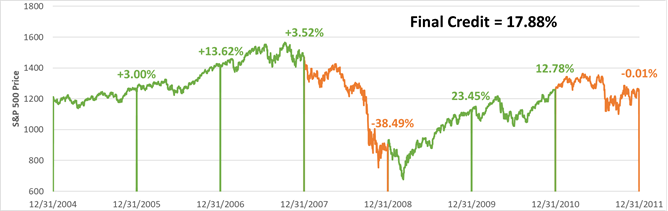
Despite the fact that Sum crediting tracks performance at intervals throughout the term, it is hedged with a single cliquet option purchased at the beginning of the term that provides the credit at the end of the term. Like any other FIA strategy, upside participation in a Sum strategy is non-guaranteed as is based on the life insurer’s yield and the market price of cliquet options. Sum strategies sometimes also limit downside exposure which, all else being equal, increases the price of the cliquet and lowers upside participation. For example, an Annual Sum strategy with a -10% downside floor and 50% Participation Rate on upside would have had the following credit:
| Year | 2005 | 2006 | 2007 | 2008 | 2009 | 2010 | 2011 | Sum Total |
| S&P 500 | 3.00% | 13.62% | 3.52% | -38.49% | 23.45% | 12.78% | 0.00% | 17.88% |
| FIA | 1.50% | 6.81% | 1.76% | -10.00% | 11.73% | 6.39% | 0.00% | 18.19% |
Fixed Index-Linked Annuities (FILA) and Annual Sum FIA
At first blush, Annual Sum FIA products and FILA have clear similarities. Both use long-dated crediting strategies with one-year tracking intervals throughout the term. Both have the potential for tracking negative values in exchange for greater upside potential. Both are positioned closer to RILA than a traditional FIA product.
But beyond these surface-level similarities, FILA and Annual Sum FIA products are completely different animals and employ entirely different methodologies to achieve their ends. Annual Sum uses a single option to hedge a single payoff, making it operationally identical to any other crediting strategy in FIA even though it has a different payoff structure. FILA, by contrast, uses true annual options over time to track values leading up to a final credit for the strategy, which is unlike any other FIA crediting strategy currently in-market.
Annual Sum FIA and FILA are mechanically different and, as a result, have stark differences between their outcomes and their key attributes. The table below highlights some of the differences in attributes between the two strategies.
| Annual Sum FIA | Fixed Index-Linked Annuity | |
| Downside Tracking Risk | Day 1 Tracking Downside Risk | Only Tracked Gains at Risk |
| Interest Crediting | Simple (Sum) | Compounding |
| Hedging Strategy | Single Hedge for Term | Annual Hedges |
| Risk and Return Profile | Locked for Term | Adjustable throughout Term |
| Transfer within Strategy | No | Yes |
| Rates Throughout Term | Guaranteed | Renewable |
| Rate Competitiveness | Lower | Higher |
Performance Comparison between FILA and Annual Sum FIA
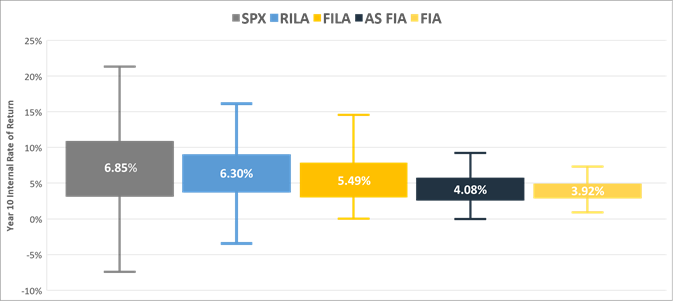
To look at the performance characteristics of the two designs, we ran 1,000 S&P 500-based return scenarios over 10 years through RILA, FILA, Annual Sum FIA (AS FIA) and traditional FIA designs using current fair-market Participation Rates calibrated to a 2.5% annual hedge budget. We assumed that the -10% Floor in the RILA and FILA have the same Par Rate while the 0% Floor in the FILA and the FIA shared the same Par Rate. For the Annual Sum FIA rates, we used a quote provided by a major third-party derivative counterparty as of mid-May 2021. The boxes represent the middle 50% of returns and the whiskers represent the top and bottom quartiles. The number in the box is the average return across all 1,000 scenarios.